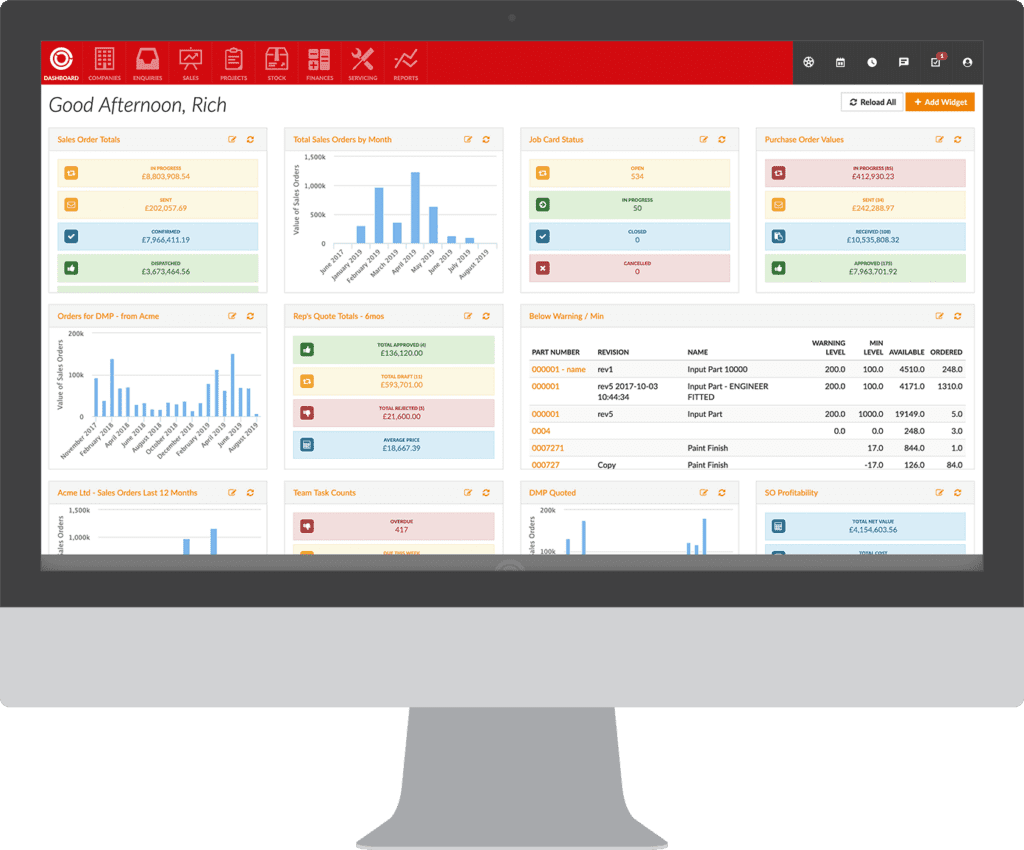
We’re delighted to launch our new Flowlens cloud manufacturing CRM and MRP Software Dashboard and Reporting capabilities. They’ve been fully redeveloped in response to customer feedback, and carry us further towards our vision of Flowlens as the single ‘lens’ for reliable manufacturing inventory, sales, customer and supplier information.
Across Flowlens you can filter data, such as sales pipeline, quotations, orders, stock levels, material requirements, production jobs, purchasing, service, customers and much more.
You can now make a dashboard that focuses on your priorities:
- Highlight operational activities, problems and progress
- Get a top down view of departmental activity by grouping users
- Monitor inventory by individual parts, categories, warning flags etc
- Monitor sales activity levels by group or individual
- Focus on individual operational priorities such as late orders, overdue jobs, outstanding service tickets and much more
- Visualise trending information such as sales by product, group and customer
The new suite brings several capabilities and styles of graphical widget, including bar and pie charts, list below, metric summaries, with more to be added in a follow-up release next month.
The powerful new approach lets you:
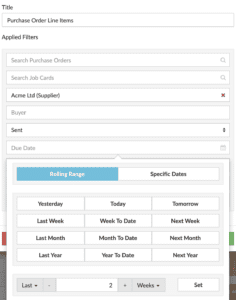
- Use search filters to create and label custom widgets
- Choose from fixed and rolling date ranges for automatic updates
- Get live metrics and totals across most reports
- Create exception widgets to highlight problems easily
- Many filters are now multi-select to easily enable grouping of required outputs
Access to reports and dashboards widgets is controlled by user permission, and users are now free to create widgets to suit their needs.
Easy To Create. Easy to Tweak.
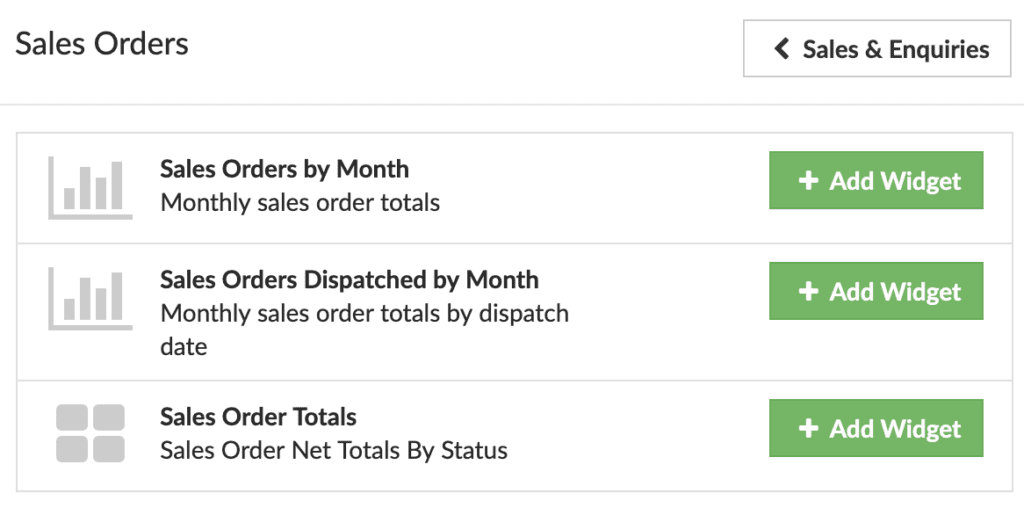
Across the system the new widget button lets you create a new dashboard widget straight from your search filter criteria, with more to be added in a follow-up release next month. You can also add and configure buttons directly on the dashboard.


